
General
Perhaps the phrase “control is an illusion” is familiar. Maybe we’ve had experiences when this was true; however, this phrase does not tell the whole story. We may have little or no control over the external environment, but we do have control over how we interact with it. We have control over our state of readiness; we can look ahead and improvise and adapt. We can actively monitor significant project risks, including highimpact, low-probability risks, and control the robustness of our response to identified risk events and the quality of our documentation. Very importantly, we have control over how earnestly we integrate risk management into our Project Management Plans.
Risk Monitoring and Control
As we continue through project development, the project risk profile will change. Typically, as we successfully respond to risks and our project knowledge increases, our risk exposure will diminish.
Risk Monitoring and Control Tools and Techniques
After we have implemented response actions, we must track and record their effectiveness and any changes to the project risk profile. Did the response actions have a positive or negative effect on achieving project objectives? If so, explain how and why in the Risk Management Plan.
Documentation of Response Actions
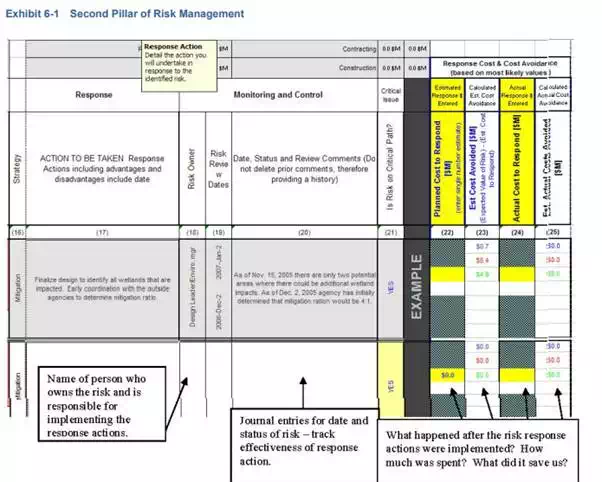
This section is devoted to measuring project risk management per performance, and determining whether a project is tracking to plan or deviating in a negative manner. This will require a blend of qualitative judgments and quantitative measures to determine the “health” of the project. The Project Manager must document the response action by describing the action, the work activities it will affect, and the cost of the response action. Identify the person(s) responsible for successful implementation of the response action. Also, consider the time impacts of the response action and how the risk response may affect the overall project and/or other risks.
The Project Manager determines appropriate metrics for the project, ensuring they are not burdensome and do not affect behavior. Too often, metrics change behavior to provide better metrics, not better performance. Set the amounts and conditions for use of the project risk reserves. Establish the final objectives of the project with stakeholders to improve the chances of project success. Confirm endorsement of team members and stakeholders as the project plan evolves.
Monitoring and Controlling Project Risk
The Project Manager and project team apply their Project Management Plan through project development and completion of their deliverables. Monitor the project status, looking for trends that can indicate variations (good and bad) in the project execution. Results of the analysis need to be communicated and adjustments made through a change management and/or issue resolution process. The ability to describe the history of the project and how it evolved is essential to developing lessons learned for the future.
Helpful Hints
· Be thorough and tenacious in gathering status update information for risks.
· Monitor status and trends continually (scope, schedule, cost estimates, quality of product, etc.).
· Address problems and issues immediately; in fact, anticipate and discuss in advance if possible.
· Communicate.
Risk Management Planning (RMP) Spreadsheet
The RMP spreadsheet is easy to use and provides an effective way to summarize project risk management activities for projects that have conducted a quantitative risk analysis The spreadsheet is typically used for the most significant risks as determined via the quantitative risk analysis; some term these risks “candidates for mitigation.”
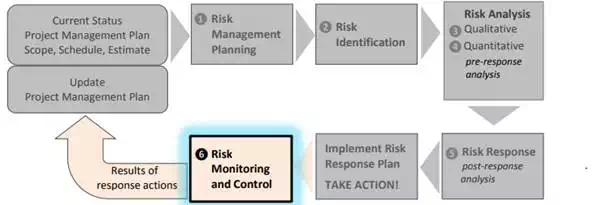
The spreadsheet is conveniently arranged into four sections: (1) risk identification, (2) risk analysis, (3) risk response, and (4) monitor and control. In this chapter, we focus on monitor and control.
Exhibit 6-1 focuses on the second pillar of risk management, as recorded in the RMP spreadsheet, and indicates how to use the entries to document the risk response actions and their effectiveness in the monitoring and control portion of the spreadsheet
The following pages describe how to use the RMP spreadsheet to monitor and control project risk.
Notice that the first group of columns in the RMP spreadsheet is devoted to IDENTIFY and ANALYZE: the first pillar of risk management. The remaining columns are devoted to the second pillar of risk management: RESPONSE, MONITOR, and CONTROL. In Chapter 5, we reviewed in some detail risk response actions; in this chapter, we follow up and follow through with monitoring and control. The way we “monitor and control” risk is to regularly review the effectiveness of the response. Are the response actions working? Are things getting better? Are we more confident about our ability to meet project objectives after the response actions have been implemented? In effect, response, monitor, and control are natural components of our day-to-day project management activities (e.g., communicate with the project team and ascertain how things are going; make note in the Risk Management Plan and document the results).
It is always prudent to quantify and analyze the project risks. Although a project may have very few risks, which may appear easily manageable, some of these risks could have a high likelihood of occurring or a high impact. Only by initiating a quantitative analysis will the likelihood, value, and impact of these risks be identified.
In Exhibit 6-2, the example project had identified over 50 risks, of which 23 were deemed significant enough to warrant inclusion in the quantitative risk analysis model. There were only 5 that emerged as the top-ranked risks. These “few” had the expected value of $7.1M and provided the Project Manager with the appropriate prioritized list of risks to manage. The other 40+ risks were not simply ignored; they provided “issues awareness” for the various specialty groups and were dealt with as each specialty group deemed appropriate for the relevant risks. These additional risks also acted as a “watch list” for the project
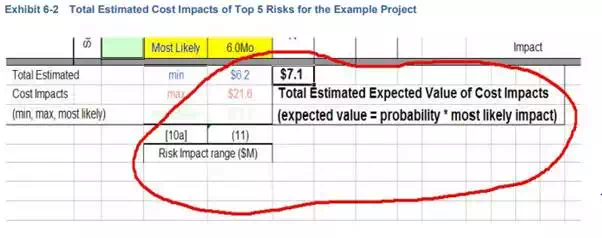
Exhibit 6-3 depicts a performance measure for the effectiveness of risk management on this project.
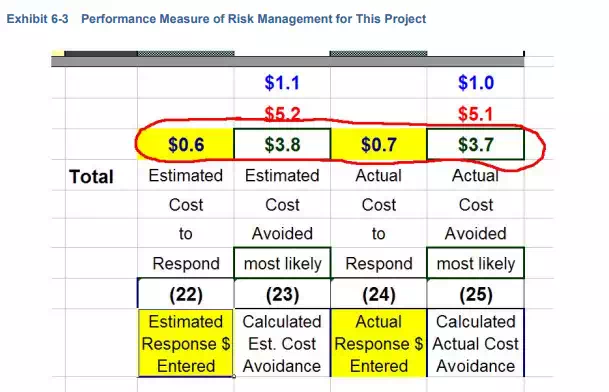
When reporting on the risk management efforts for this project, we can summarize as follows:
The total dollar amount planned for response actions was $0.6M, to achieve reduced project risk exposure by an estimated $3.8M (expected value of risk reduction). After implementing the response actions, we found the total cost of the response actions was $0.7M, which avoided an estimated $3.7M in project costs.
This example illustrates an excellent return on the dollar for risk management efforts. Other benefits, less quantifiable, included:
· Improved communication among team members and externally with stakeholders and the public.
· Identified areas of concern for each specialty group as it helped develop the risk register during risk elicitation.
· Greater confidence by the Project Manager and project team during project development.
· Fewer surprises as upper management was informed of the issues.
· More informed decision making, due to information gleaned from the overall risk workshop and risk management effort.