People love pictures! For most, it’s easier to retain information seen in a picture or a graphic. When presenting project schedule information, project timelines are the preferred choice, instead of viewing complex Gantt charts.
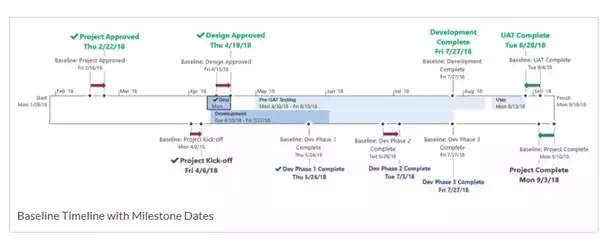
One of the most common requests from project sponsors is to show the baseline information on a Timeline, so they can visually compare the baseline milestone dates to the current milestone dates. However, MS Project does not currently have that capability. So, I’m about to tell you how you can present a timeline that looks like this!
Steps to display timeline above:
- Build your project schedule and make sure you have milestones defined and the tasks linked.
- Set your baseline for the entire project.
- Build your project timeline by adding summary tasks and milestone tasks from the Gantt chart. You can do this by right-clicking on the task and selecting “Add to Timeline”. The summary tasks are displayed in the middle of the timeline, and the milestones tasks are noted with diamonds and displayed on the outside of the timeline.
- I like to enlarge the milestone fonts in the timeline and color coordinate to summary tasks, or identify payment milestones (green), etc… You can do this by selecting the text on the timeline and in the upper left corner there are font attributes to choose from.
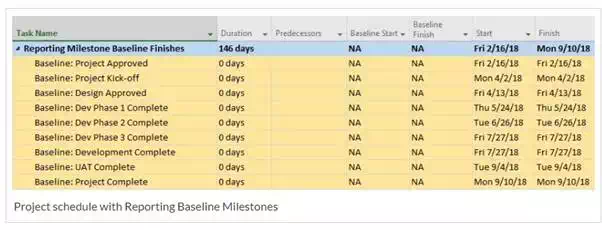
- At the end of your project schedule, add a section for reporting milestone baseline tasks, like below. This section should start at Level 0, so these reporting tasks do not impact your schedule.

- Create the reporting baseline milestones tasks with a 0 duration, do not assign predecessors, and manually enter the baseline finish dates from the real milestones from the schedule above.
- Add the reporting baseline milestone tasks to the project timeline.
- For clarity, keep the baseline tasks grey and locate them closer to the timeline in a smaller font. Also, make sure the reporting baseline milestone task is on the same side as the real milestone task for arrow drawing later.
- With a Snipping Tool, cut the picture of the timeline and copy it to a PowerPoint Slide.
- In the PowerPoint slide, add the arrows to show how the milestone as shifted – red for moving out and green for moving in.
- If the baseline is close to the current date, there is no need for an arrow.
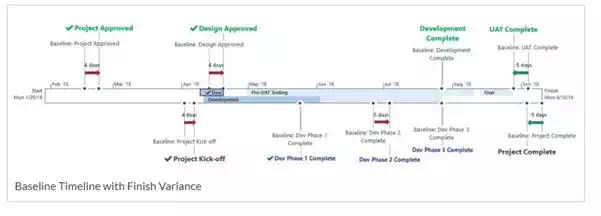
Another version of this timeline is to have no dates and/or display the days shifted. This version is great for project timelines that are too busy to read. The dateless timeline looks like this:

Steps to display timeline above:
- In the project schedule, you will need to insert the Finish Variance column. Select the column you want the new column to be in front of, right-click to select Insert Column and select the Finish Variance field. The Finish Variance calculates the difference between the Baseline Finish date and the current Finish date.
- In the project timeline, turn off the task dates by using the dropdown menu from the Format tab selecting the Date Formats. At the end of the menu there is a Show/Hide section, uncheck the Task Dates.
- With a Snipping Tool, cut the picture of the timeline and copy it to a PowerPoint Slide.
- In the PowerPoint slide, along with adding the arrows, add a text box to indicate the number of days the milestone shifted out (positive number) or in (negative number). The number of days can be gotten from the Finish Variance field in the Gantt chart. If the baseline is close to the current date, there is no need to display the days.


