Defining what “done” really means is very important. There are many versions of “done” within the life of your project—what it means to be “done” with a story, release, or whole project. It all boils down to what you, your team, and business will consider as complete to the right level of quality to satisfy readiness to ship.
For your team, the definition of a “done” story will be something like all code complete, peer reviewed, meets the defined acceptance criteria, unit tested, UAT’ed, and pushed to your code repository. To enable the passing of a story from designer to developer to tester, definitions of “done” will have to be accepted by the next person in the chain. Your product owner will have expectations as to what this means to them in order to release the product increment to your customers. In any case, everybody must be aware of what “done” means and be a responsible party in ensuring its meaning is met. Define your definition of “done,” communicate it, agree upon it and, evolve it. Done done.
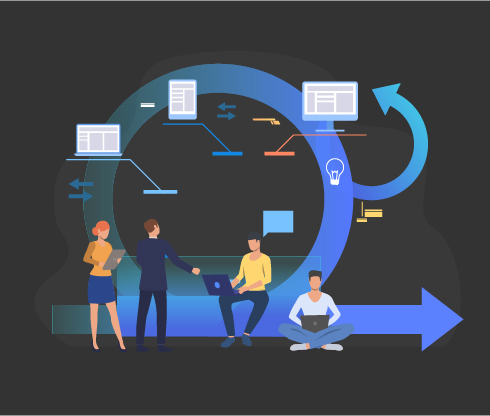
Continuous Measurement
If you can’t measure it, you can’t manage it. The same goes for improvements. The need to gather empirical data in an Agile project is almost as vital as having blood course through your veins! How do you know what needs managing, correcting, or improving if there’s no data? Well, simply put, you’ll be relying on gut feel and unsubstantiated guesswork, which falls apart pretty quickly under scrutiny. And depending on who’s doing the scrutinizing, this can be a rather uncomfortable place to be. So from the outset of your project, ensure you know how you are going to demonstrate progress and by what measures others are going to view your success.
Fortunately, Agile comes loaded with useful tools and techniques. The first thing to do is go back to the Agile Manifesto, type the following words into your favorite word processor, blow them up to 96pt, print, and apply to the wall for all to see :
Your greatest demonstrable power in delivering software is to show it to people working, doing what it’s supposed to do. Not only will this make your customers happy, it will earn your team great respect and grease the wheels for greater adoption through the business.
Here are some other tools:
· The daily standup: There are a few variations of this ceremony, but the essence is to have all team members talk to each other face to face: Keep it short, keep it focused, and keep it light. If anything needs discussion at great length, park it for a longer conversation between those needed after the standup. If impediments are raised, write them up like a story, add them to your backlog, and get them addressed asap. Anything that is impeding your team slows their progress and will be demonstrable in reduced velocity and software that does not meet expectations.
· Velocity: Is a historical tool. It’s a little like those financial warnings you get that says past performance is no guarantee of future performance. But in Agile’s case, we do hope to achieve a team velocity that is largely smooth. It’s velocity that allows us to project future performance and confidence in our plans. There may be influences outside your control which might lower the number of story points output for a given sprint. If this happens, you’ll probably be able to recover. Never use velocity as a stick to beat your team with; it will win you no favors. One thing for sure is that velocity will be erratic for the first 2–4 sprints. Somewhere in that timeframe, though, you should start to see consistency and stability. If your velocity is wavering from one extreme to another, you’ve got a problem which you’ll need to fix with your team.
· The burndown chart: Now this measure of progress is a thorny one. For that reason, I haven’t given a link to go find out more—you’ll have to do your own research and agree as a team and business which works for you. The reason it’s thorny? Well, not one resource out there tells the same story! One thing agreed upon is that it will show, within a sprint or a release, how you’re performing against your timebox. If maintained daily, it will show if you’re on track or deviating. Some teams use it to represent how much value is left to be created, more often than not, others use it to show how much work is left to be completed. The former is a celebration of success and value generation, the latter is less inspiring and motivating.
· The burnup chart: If you must show work completion rates, use the burndown chart for that. But using the burnup chart allows you to show how much value has been created and how much more value you’re planning to create by the end of the sprint. A much more motivating tool for a team to both demonstrate to the business what has been done (or little if things aren’t going so well…) and what they still have their sights set on. In any case, use the charts to spot where progress is not tracking as expected and look for patterns or deviations and get on top of them to fix the underlying problem as soon as possible. Update them daily for sprints and once at the end of a sprint for release version charts.
· Task boards: These are great visual radiators for demonstrating value being created. When updated daily, or at any point in the day, they immediately show progress being made. If combined with Kanban, they’re also great tools for visualizing flow and blockages in the system. If you can see that lots of development has been completed, but testing is not as productive, you can see the problem happening and respond appropriately and swiftly.
Keep these measures, charts, and other tools visible, preferably loud and proud on a wall for all to see. The team, stakeholders, and other interested parties can immediately see the status of a project. It’s transparent and serves as a valuable communication tool. If you can’t put these artifacts on a wall, use tools that are sharable and collaborative and make sure those that want access have it.